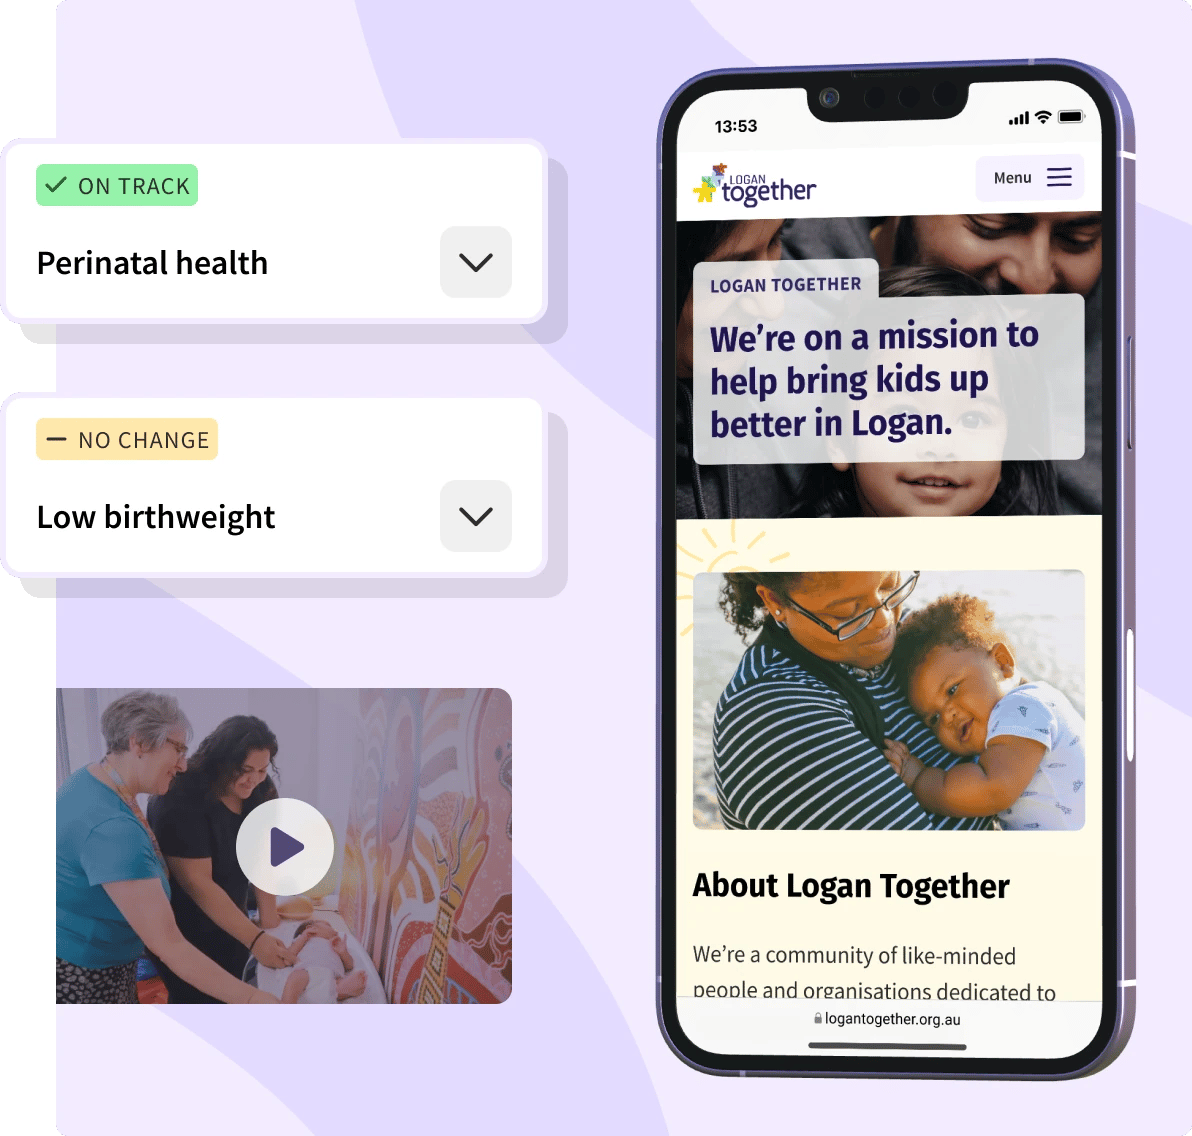
Stronger Together Logan
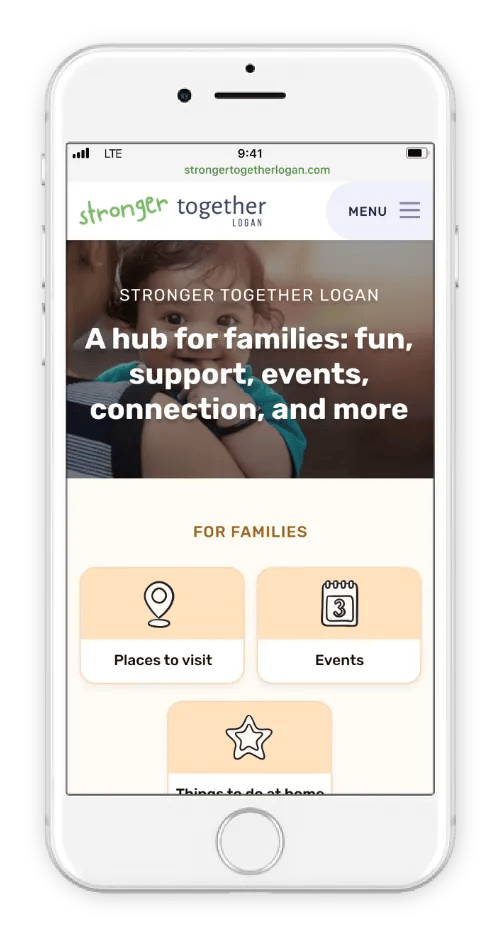
Stronger Together Logan is a website which helps families in Logan, QLD support their kids' development. The initiative was created by Logan Together, as part of a broader range of measures to tackle lower levels of child development.
The platform was initially set up in March 2020 during the COVID-19 lockdown in Queensland to provide fun, informative and trustworthy resources for kids and parents.
Following the lockdown, Logan Together wanted to know how the platform could be evolved to support the community's needs better.
The challenge
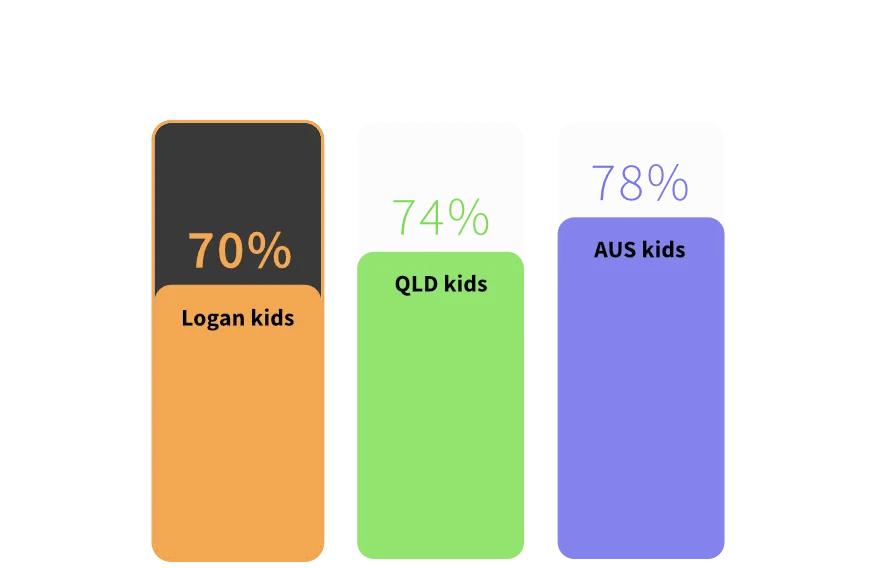
Logan is a diverse, fast-growing community in Queensland with approximately 330,000 residents and a broader range of backgrounds than found even in New York City. However, the city has consistently reported lower levels of child development compared to the rest of Queensland and Australia.
Logan Together emerged as a 10-year movement to tackle the persistent disadvantage and developmental vulnerability many children in Logan face.
The team behind Stronger Together Logan wanted to understand:
- Whether there was a need for their online platform post-lockdown
- How we could evolve it to meet users' needs better
- How we could provide a soft entry point for people needing further, more specialised support
Deliverables
- Discovery research
- Usability testing
- High fidelity prototype
- Wordpress website
Team


Client


Time
1Research
Because several regions of Logan experience systemic disadvantage, getting to talk with local parents 1-1 was a challenge. We worked with the Logan Together backbone team to uncover research opportunities in a way which was respectful of difficulties residents may be facing.
 Website feedback survey
With the site receiving around 70 sessions per week, our first tactic was to post a feedback survey on the website's homepage for 2 weeks.
We received only one response, and this was submitted by a member of the Logan Together backbone team. Unfortunately, we had to look elsewhere to get the data we needed.
 Interviews
We interviewed three community leaders, four stakeholders and two parents from the site's original focus group.
We uncovered a strong sense of community and trust between parents, a wide range of issues affecting the community, and difficulty accessing information online due to information being very fragmented.
“We’re a family of 6 soon, you know, money doesn’t go very far these days."
“You’ve got to go through 20 different [emergency relief websites] to find one place that’s still operating."
Parent survey
With the help of the owner of a Logan-wide Facebook group for mums, we posted a survey to find out what role social media plays in the community and identify what types of information parents would like to access online. We received 213 responses, 173 of which were parents of at least one child eight years old or younger and were relevant for our platform.
 Google Analytics
We used Google Analytics to identify which parts of the site were most accessed. We found that most users were landing directly onto a few individual posts, primarily through links on social media, rather than navigating the website starting from the homepage.
2Insights
Types of online content in high demand
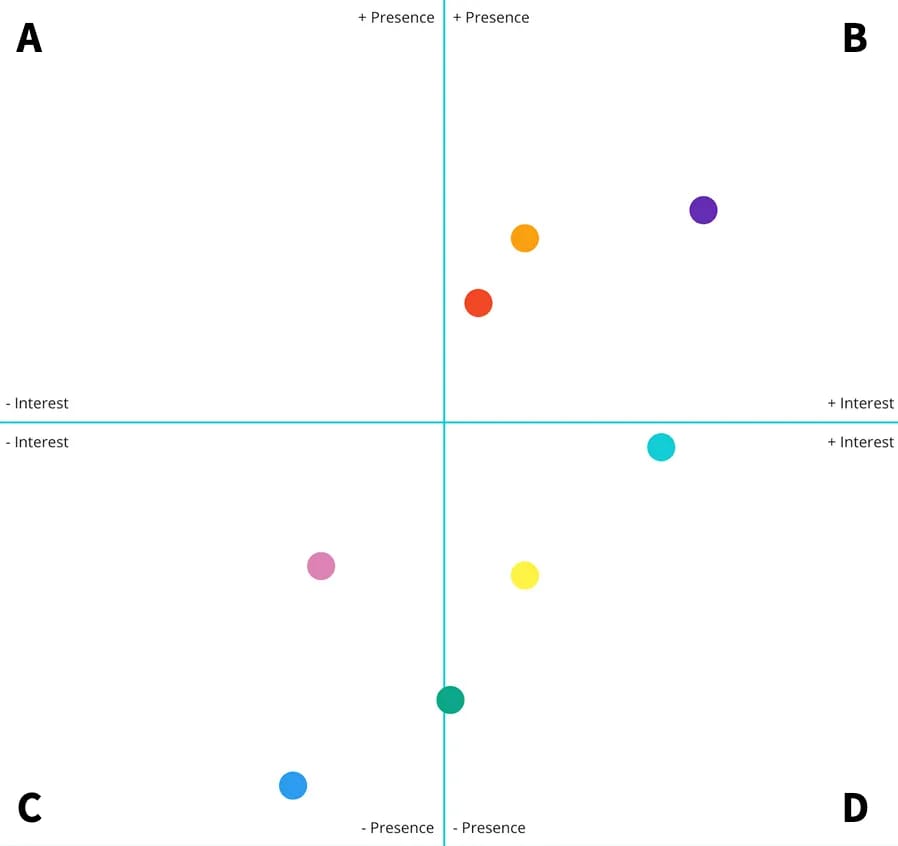
From our parent survey, we identified key gaps in the information which parents wanted to access online but currently didn’t access online (quadrant D). We would focus on addressing these topics in Stronger Together Logan:
- Playtime activities
- Access to local support services
- Local pampering opportunities
We also took note of the topics which interested parents and which they currently accessed online (quadrant B). We speculated that we could use content on these topics to help draw parents to Stronger Together Logan and so raise awareness of the support resources available there:
- Local events
- Local news
- Parenting advice
Signs of disconnect with local community
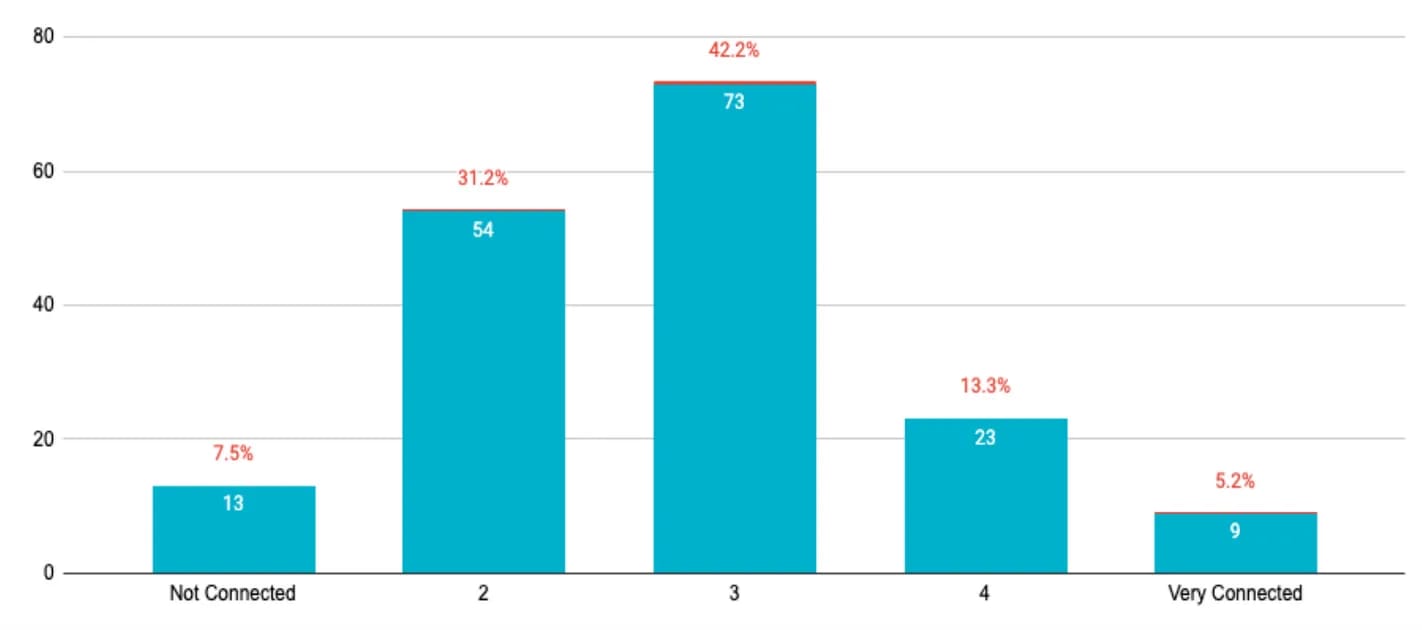
Our survey revealed that more respondents felt disconnected to their community than those who felt connected. In fact, only 18.5% parents said they felt connected to their community (options 4 or 5).
From our discovery interviews, we learned of the importance of families having a good local network, and speculated that this lack of connection could be detrimental.
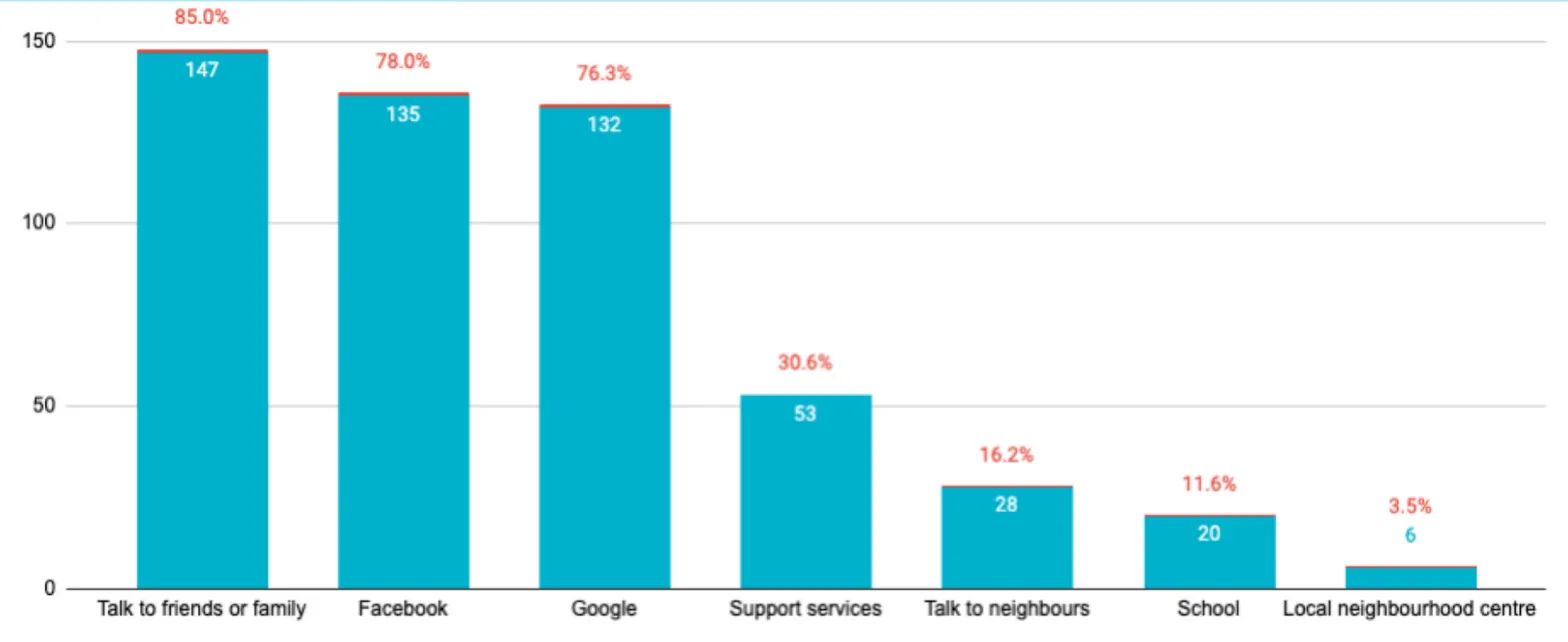
Parents look online for help
78% parents look for help or advice on Facebook, and 76.3% on Google. Only talking to friends or family (85%) was more commonly stated.
This presented a clear opportunity to make information more readily available via these platforms.
3Ideation
I facilitated a remote ideation workshop with 5 stakeholders to brainstorm ways to evolve the Stronger Together Logan platform.
To help ideation workshop participants put themselves in users’s shoes and generate more relevant ideas, I created a persona and 2 empathy maps, built from research insights and assumptions from stakeholders.
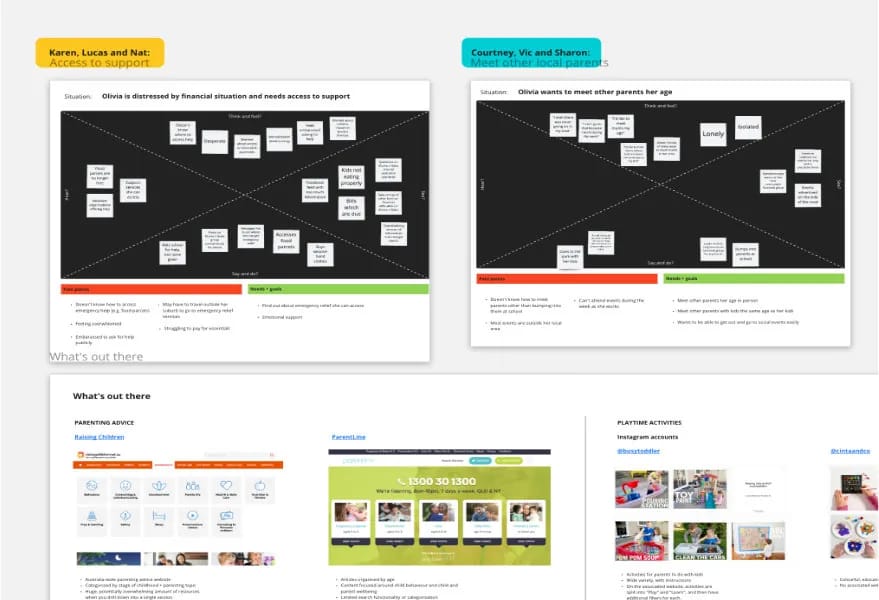
Opportunities
We ideated around two major opportunities identified from our research:
1. How might we make Olivia feel more connected to her community?
2. How might we improve access to support for Olivia?
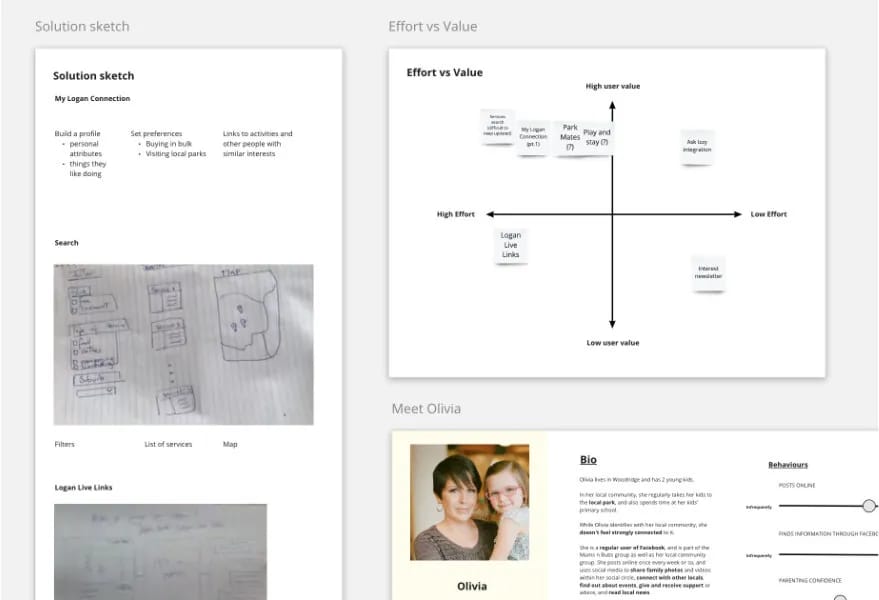
Participants were given time to review the discovery research insights before doing two rounds of crazy eights, dot voting, creating a solution sketch of the idea they saw most promise in, and finally we categorised the ideas based on effort vs value to Olivia.
Winning solution
Enable Olivia to find support services in her area anonymously online via Ask Izzy
In our research, we found that there was poor online visibility of what support services are available and that many parents were looking online for help.
We decided to test integrating Ask Izzy’s service directory into the platform to help users know where to go for help.
4Testing and prototyping
Iteration 1
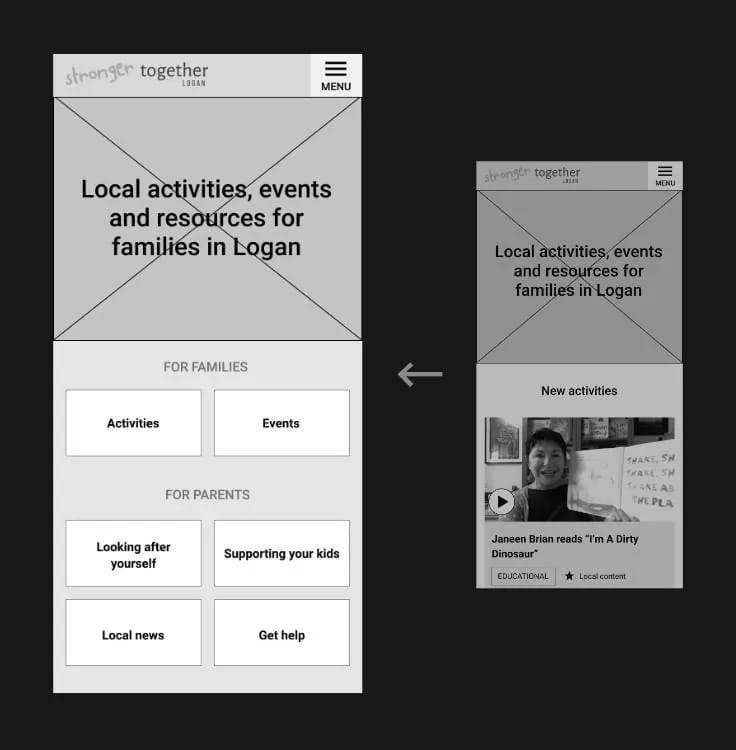
The initial mobile prototype
Based on our ideation workshop and our research insights, we identified several goals for the platform’s evolution:
- Integrate Ask Izzy
- Improve the organisation of the site
- Provide access to events online
- Provide access to local pampering opportunities
We created a low-fidelity prototype to accommodate for these goals, ready for usability testing.

Navigating the site
How would you browse local events?
"Not sure."
Our first tester could find almost none of the content on the site. Seeing this critical issue, we iterated immediately to try and make easier for testers to navigate the site.
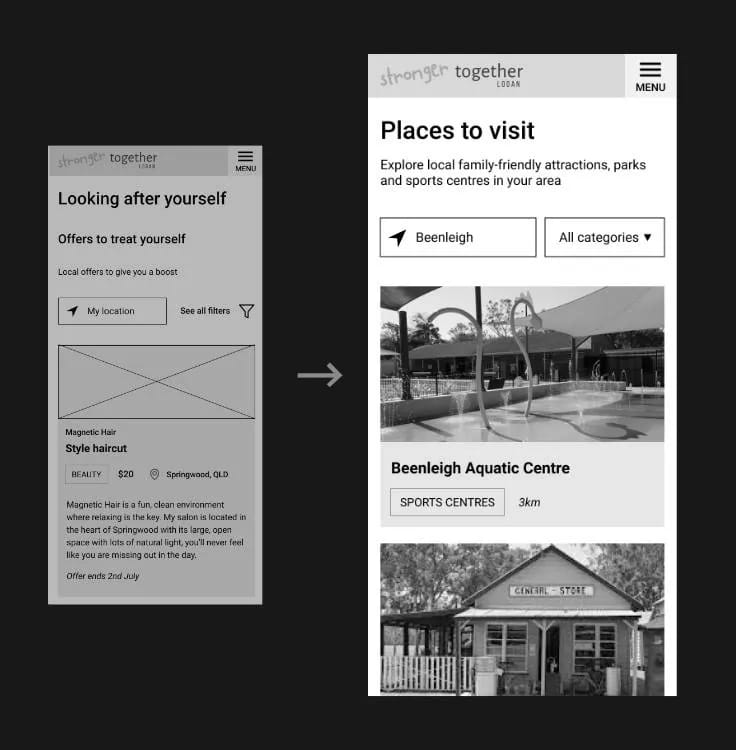
Pivoting from offers to places to visit
We created an offers section based on the need for “local pampering opportunities.” However, when we tested this section, we received mixed opinions. We also had reservations about how it could be built and maintained.
By contrast, 3 out of 8 of our testers suggested having local parks or playgroups on the website.
“It’s really hard to find good parks."
Fitting our testers’ mental model
A key challenge was understanding where users expected to see the different types of content on the site and how they differentiated them.
We learnt that users distinguish places and events by how often they can be accessed. Something which runs weekly, for example a playgroup, was seen as a place to visit, whereas something which runs monthly or one-off was seen as an event.
Places to visit
- Playgroups
- Parks
- Museums
- Sports culbs
Events
- Markets
- One-off events
- Family fun days
- Community events
- Recurring events
Things to do at home
- Sport & exercise videos
- Playtime activites
- Educational activities
Iteration 4
Features of the final prototype (TO FILL IN)
Finding local events
Testers said that information on local events was often hidden away in hard-to-find Facebook groups. While they were typically part of their suburb’s Facebook group, many testers had little visibility on events going on elsewhere in Logan.
“Oh! I didn’t know they had family fun day coming up on the 25th July!"
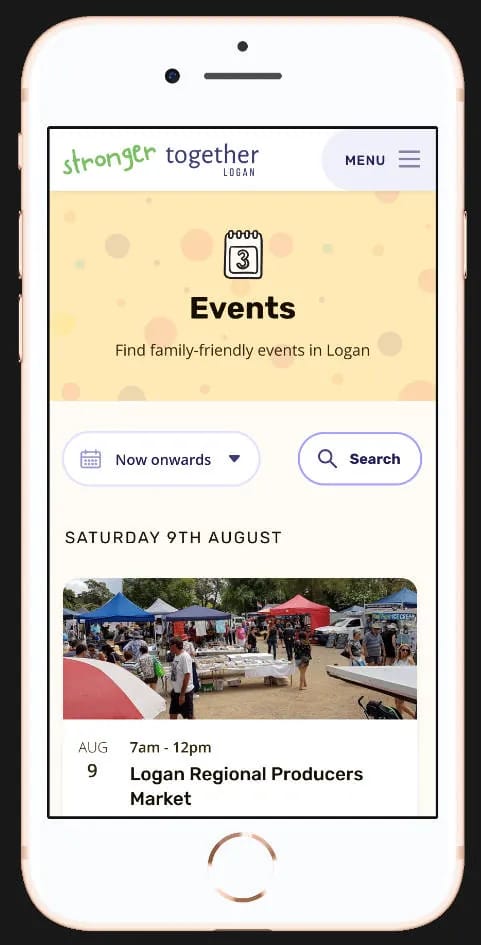
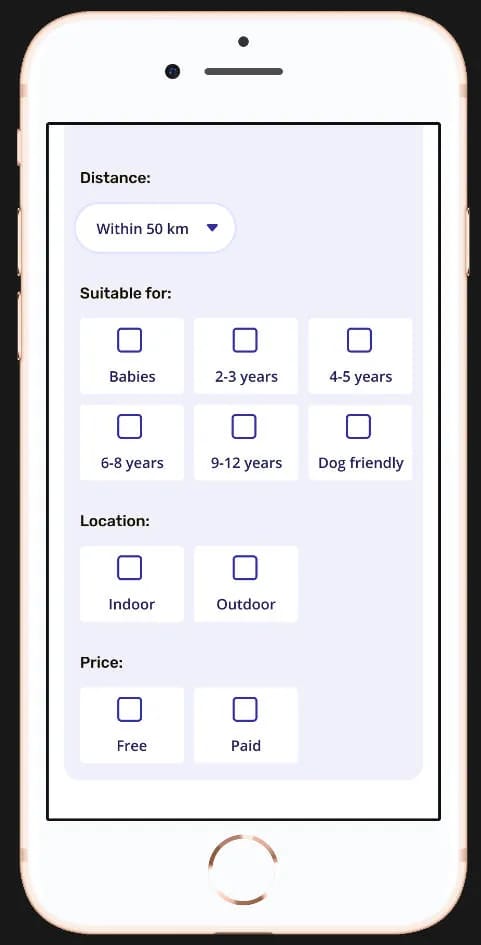
Filtering events
Testers wanted to narrow down events based on a range of practical constraints. Some testers wanted to filter by distance from their location because their child didn’t travel well. Others wanted to filter by whether events were held indoors or outdoors so that they could find weather-appropriate events.
“If it was something a little bit further away we might make a day of it"
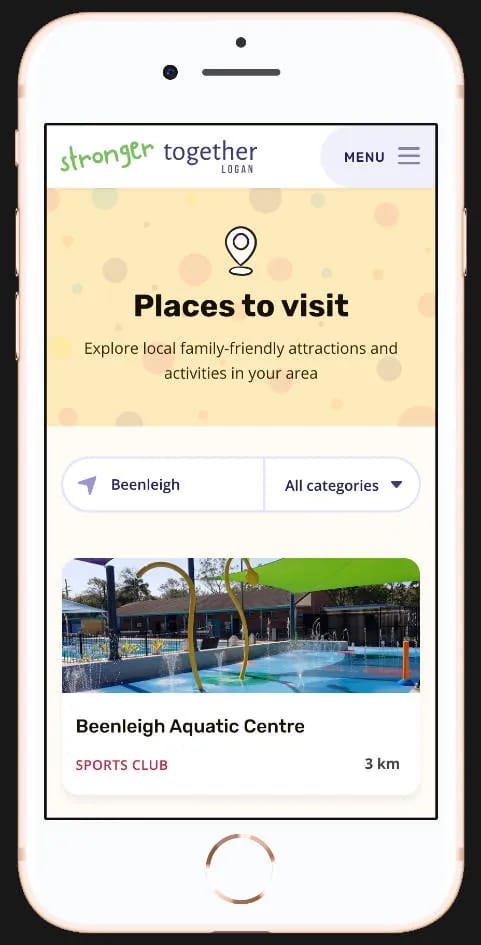
Finding local places to visit
Many testers cited that information around local parks, playgroups and attractions was often fragmented, hard to find, or out of date. Many of them expressed a weariness and two testers described the process of finding information via Facebook and Google as a “treasure hunt."
On Stronger Together Logan, we built “Places to Visit”, a feature which shows parents local parks, playgroups, attractions and sports groups ordered by proximity to their location.
"We’ve found some really good parks that have never really been listed anywhere"
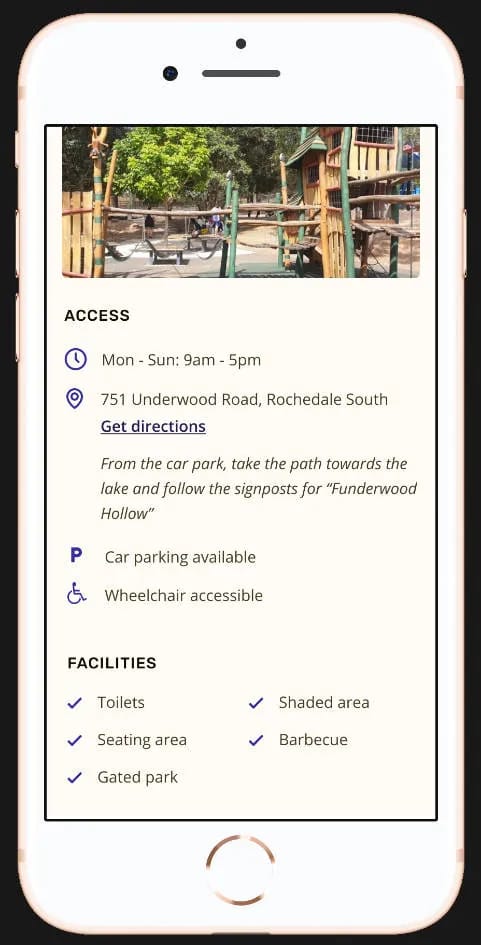
Getting information on local parks
Testers needed to quickly find information before they go somewhere new. Their feedback guided which content they needed to see on the place details page to allow them to plan their trip.
"When you're looking for a park with your family, sometimes you need to know exactly what you're in for before you get there"
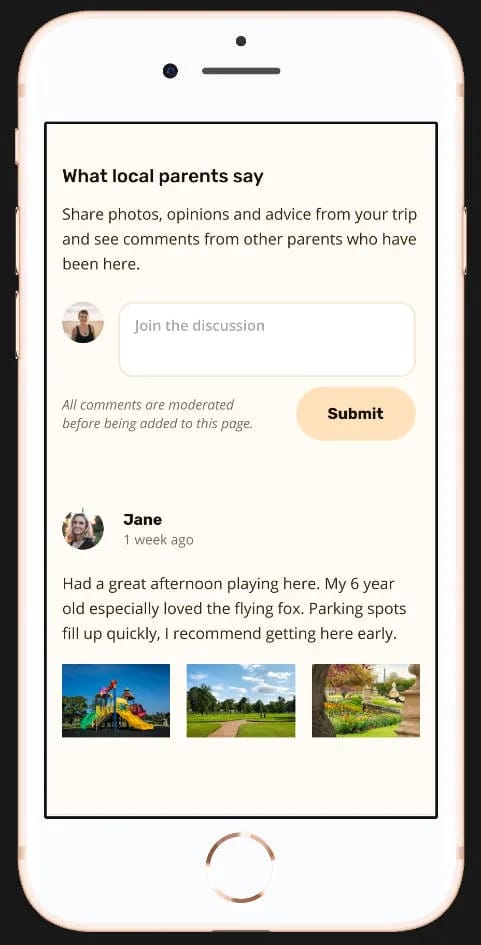
Sharing experiences about local places
We found that local parents trusted each others’ advice. Several of our testers said they were happy to share their experience publicly to help another parent decide whether an activity would be suitable for their child.
"I really like that, because I think a lot of parents relate to what other parents say about places"
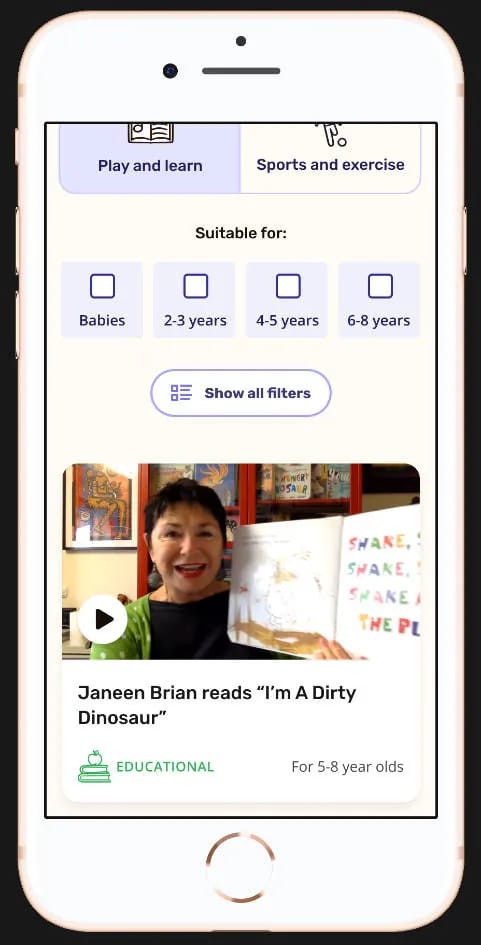
Things to do at home
Stronger Together Logan had amassed a huge library of videos and at-home activities to help families during Queensland’s Covid lockdown. We restructured this content and created new filter options in order to help parents find something their child would be interested in.
“Nature play bingo - that looks perfect actually... I’ll probably come back for that one"
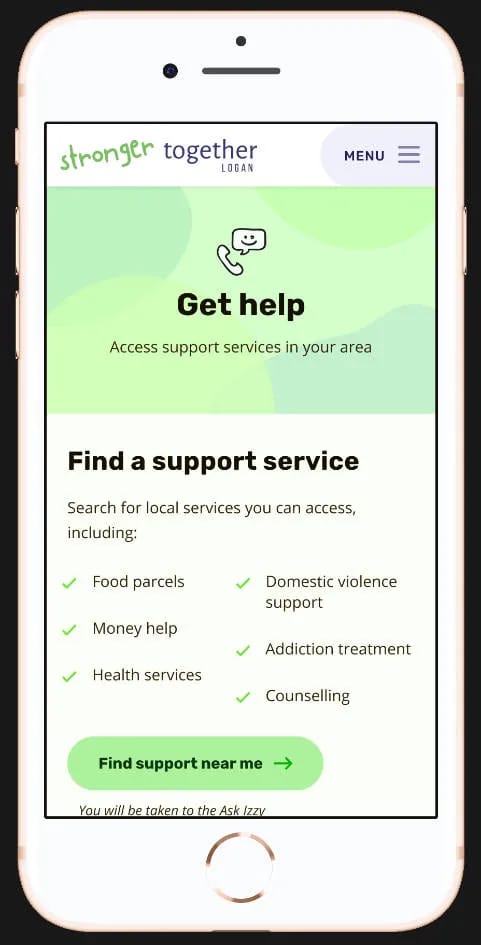
Finding a support service with Ask Izzy
We created a “Get help” page to direct families to local support services via Ask Izzy, as well as providing the phone number for Parentline for phone counselling for parents.
The access to Ask Izzy’s directory was seen as very practical and useful by testers, almost all of whom hadn’t heard of it before.
“This is amazing. This is something that would really help a lot of people."
Final prototype

"It's perfect, because there's just so many places you can go to and get information. If you've got everything in one place, then you don't need to go anywhere else."
“It’s not just set up because it needs to be set up; it’s set up to actually help people."
“I really like the colours and the design of it - I think it’s really good. It’s very clear, it’s not too overwhelming when you look at it."
“What you’re aiming for with this site would suit me to a T. I really like how it’s designed."
Outcome
"The people that were recruited totally nailed the brief and did a great job working well as a team. They’ve been able to listen, find out and develop something that we need."
After presenting the prototype and testing feedback to the stakeholders, they were excited to proceed with the project build.
Lucas developed the website in WordPress and we provided Logan Together with a digital guide on Notion, including video walkthroughs and a section for external collaborators who want to add their own events and local places to the platform.
We helped migrate old content over, and Logan Together is began content populating the website with events and places. Unfortunately, following a change in leadership, the project was not launched live.